Python/Analysis
[Analysis] scikit-learn 선형회귀분석
gangee
2022. 11. 8. 22:22
728x90
반응형
선형회귀의 종류
1. 단순선형회귀
- 하나의 x값만으로 y값을 설명할 수 있을 때
- 회귀직선이 일차함수그래프임
- x는 독립변수, y는 종속변수 (x값에 따라 y값이 달라짐)
2. 다중선형회귀
- x값이 여러 개 필요할 때
- 두 개 이상의 독립변수들과 하나의 종속변수의 관계를 분석하는 방법
- 단순회귀분석을 확장한 것
Python package 가져오기 및 matplotlib출력 옵션 설정
from sklearn import linear_model
import numpy as np
import pandas as pd
import matplotlib
import matplotlib.pyplot as plt
%matplotlib inline
matplotlib.style.use('ggplot')- linear_model : sklearn 패키지에서 제공하는 선형회귀분석을 할 수 있게 도와주는 모듈
- %matplotlib inline : matplotlib의 시각화 결과를 Ipython notebook 안에서 출력하는 함수
- matplotlib.style.use('ggplot') : matplotlib 패키지에서 제공하는 스타일 중 'ggplot'을 지정해서 사용
데이터 만들기
1. 단순선형회귀
data = {'x' : [13, 19, 16, 14, 15, 14],
       'y' : [40, 83, 62, 48, 58, 43]}

data = pd.DataFrame(data)- data : 임의로 x, y 이름을 가진 리스트형식에 데이터를 생성하여 pd.dataFrame형으로 변경 후 저장한 변수
2. 다중선형회귀
data = {'x1' : [13, 18, 17, 20, 22, 21],
       'x2' : [9, 7, 17, 11, 8, 10],
       'y' : [20, 22, 30, 27, 35, 32]}

data = pd.DataFrame(data)
X = data[['x1', 'x2']]
y = data['y']- X : 'data'변수에 'x1', 'x2' 데이터만 저장한 변수
- pd.DataFrame() : 2차원의 수정 가능한 테이블 형태의 데이터 구조를 만드는 함수
데이터 학습
linear_regression = linear_model.LinearRegression()
linear_regression.fit(X = pd.DataFrame(x), y=y)
prediction = linear_regression.predict(X = pd.DataFrame(x))
print('기울기 : ', linear_regression.intercept_)
print('절편 : ', linear_regression.coef_)- linear_regression : 선형회귀분석 모델을 저장한 변수
- linear_model.LinearRegression() : 선형회귀분석 모델을 만드는 함수
- linear_regression.fit() : 선형회귀분석 모델에 맞게 학습하는 함수
- prediction : 학습된 선형회귀분석을 이용해 나온 예측 값을 저장한 변수
- linear_regression.predict() : 학습된 선형회귀분석 모델을 통해 새로운 값을 예측하는 함수
- intercept : 선형회귀분석식의 a계수
- coef : 선형회귀분석식의 b계수
- *단순선형회귀 기준, 다중선형회귀인 경우 pd.DataFrame() 안의 x값만 변경
적합도 검증
residuals = y-prediction
residuals.describe()- residuals : 회귀분석 모델의 예측 값 y와 실제 값 y의 차이인 잔차를 저장한 변수
- 잔차 : 오차 값
성능평가하기
from sklearn.metrics import mean_squared_error
from sklearn.metrics import mean_absolute_error

print('score = ', linear_regression.score(X = pd.DataFrame(x), y=y))
print('MSE = ', mean_squared_error(prediction, y))
print('MAE = ', mean_absolute_error(prediction, y))
print('RMSE = ', mean_squared_error(prediction, y**0.5))- MSE : 평균 제곱 오차
- MAE : 평균 절대 오차
- RMSE : MSE에서 구한 값에 루트를 적용한 값
- mean_squared_error : sklearn 패키지에서 제공하는 MSE를 구하는 모듈
- mean_absolute_error : sklearn 패키지에서 제공하는 MAE를 구하는 모듈
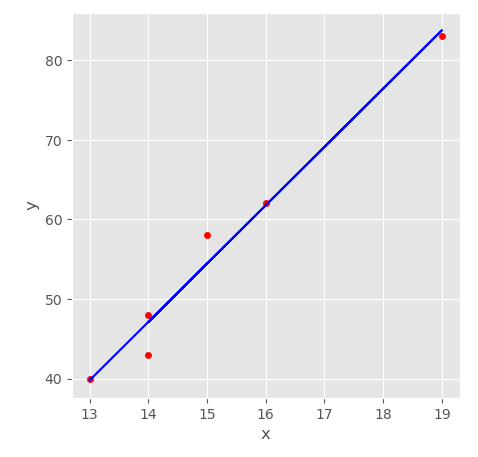
예측하여 플롯으로 나타내기
data.plot(kind="scatter", x='x', y='y', figsize=(5,5), color='red')
plt.plot(data['x'], prediction, color='blue')- plt.plot() : 선이나 마커를 플롯하는 함수
- kind = 'scatter' : 플롯을 스타일을 점으로 표현
728x90
반응형